Your AI's Memory Is a Black Box. Constellation View Makes It Visible.

When agent memory works, it feels obvious. The model remembers the right thing, surfaces the right context, and behaves like it has actually learned something.
When it fails, it feels random.
A user asks why the agent recalled one detail but missed another. A teammate wants to know whether the bank is building useful structure or just accumulating facts. You look at raw recall output, fact lists, and prompts, but you still do not have a good picture of the memory itself.
That is the real problem Constellation View solves.
Constellation View — introduced in Hindsight 0.5.0 and extended in 0.5.2 with the Entity Co-occurrence Graph — gives you an interactive graph of the entities and relationships inside a bank. Instead of treating long-term memory as a hidden subsystem, you can inspect it as a living structure: what clusters together, what turns into a hub, what stays isolated, and what kinds of links are actually being formed.
For teams building serious agent systems, that is more than a nice UI touch. It is a debugging tool, an explainability tool, and a fast way to tell whether your memory configuration is producing something useful.
TL;DR
- Constellation View gives you a graph of the memories inside a Hindsight bank
- The Entity Co-occurrence Graph (added in 0.5.2) shows which entities appear together across memories
- Both are interactive: zoom, pan, hover, click through, inspect connected structure visually
- Link types are color-coded; more connected nodes appear brighter so important hubs stand out quickly
- These are visibility tools, not retrieval guarantees — if your retain rules are weak, the graph will faithfully expose that too
The Problem
Long-term memory systems are usually hard to trust for one simple reason: they are hard to see.
You can tell an agent to retain facts. You can run recall. You can inspect prompts. But none of those views tells you what the bank looks like as a whole.
That matters because memory bugs are often structural.
Maybe the system is creating lots of generic entities that connect to everything, which makes the graph noisy and retrieval less precise. Maybe a set of facts that should clearly relate to each other never forms enough links, so recall misses them unless the query is phrased just right. Maybe a user profile is becoming a strong hub, but project-specific context is staying fragmented and hard to retrieve.
You will not catch those patterns quickly by reading one recall result at a time.
If you are working on agent memory in production, you usually need answers to questions like these:
- Are the important entities actually becoming connected?
- Are we building meaningful clusters or just a pile of disconnected facts?
- Is one noisy entity dominating the bank?
- Did a change to retain behavior improve the structure or make it worse?
- Can I explain to another engineer why the agent recalled this answer?
That is the gap Constellation View and the Co-occurrence Graph close.
Two Complementary Graph Views
Constellation View
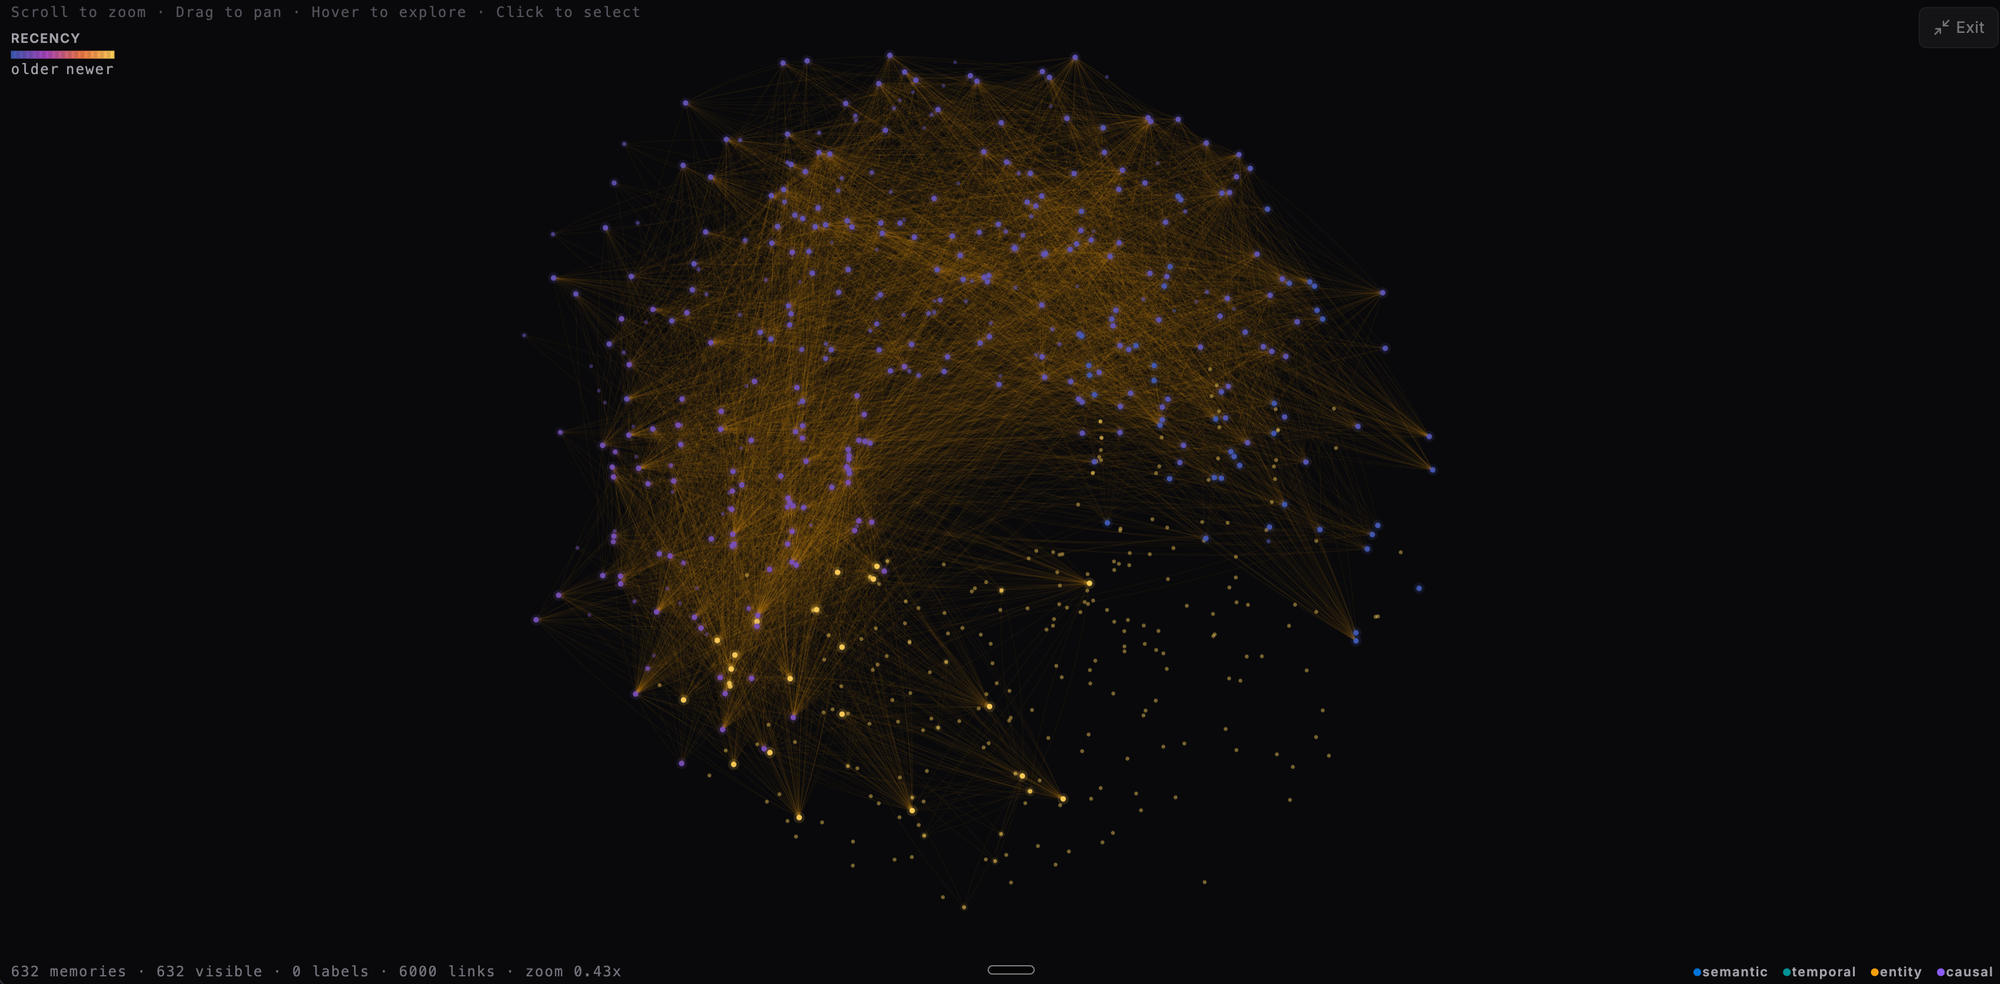
Constellation View renders the memory entity graph in the Hindsight Control Plane as a zoomable, pannable canvas.
At a glance, you get a map of your bank:
- Nodes represent entities or memory items in the graph
- Links show relationships between them
- Link colors tell you what kind of relationship you are looking at
- Node brightness reflects connectivity, so hubs stand out immediately
- Stable layout means the graph remains recognizable between visits instead of re-randomizing every time you open it
That stable layout is a bigger deal than it sounds. If the graph reflows randomly on every render, you cannot build intuition. You cannot compare before and after a configuration change. Constellation View uses deterministic positioning so the bank feels inspectable instead of ornamental.
Entity Co-occurrence Graph (0.5.2)
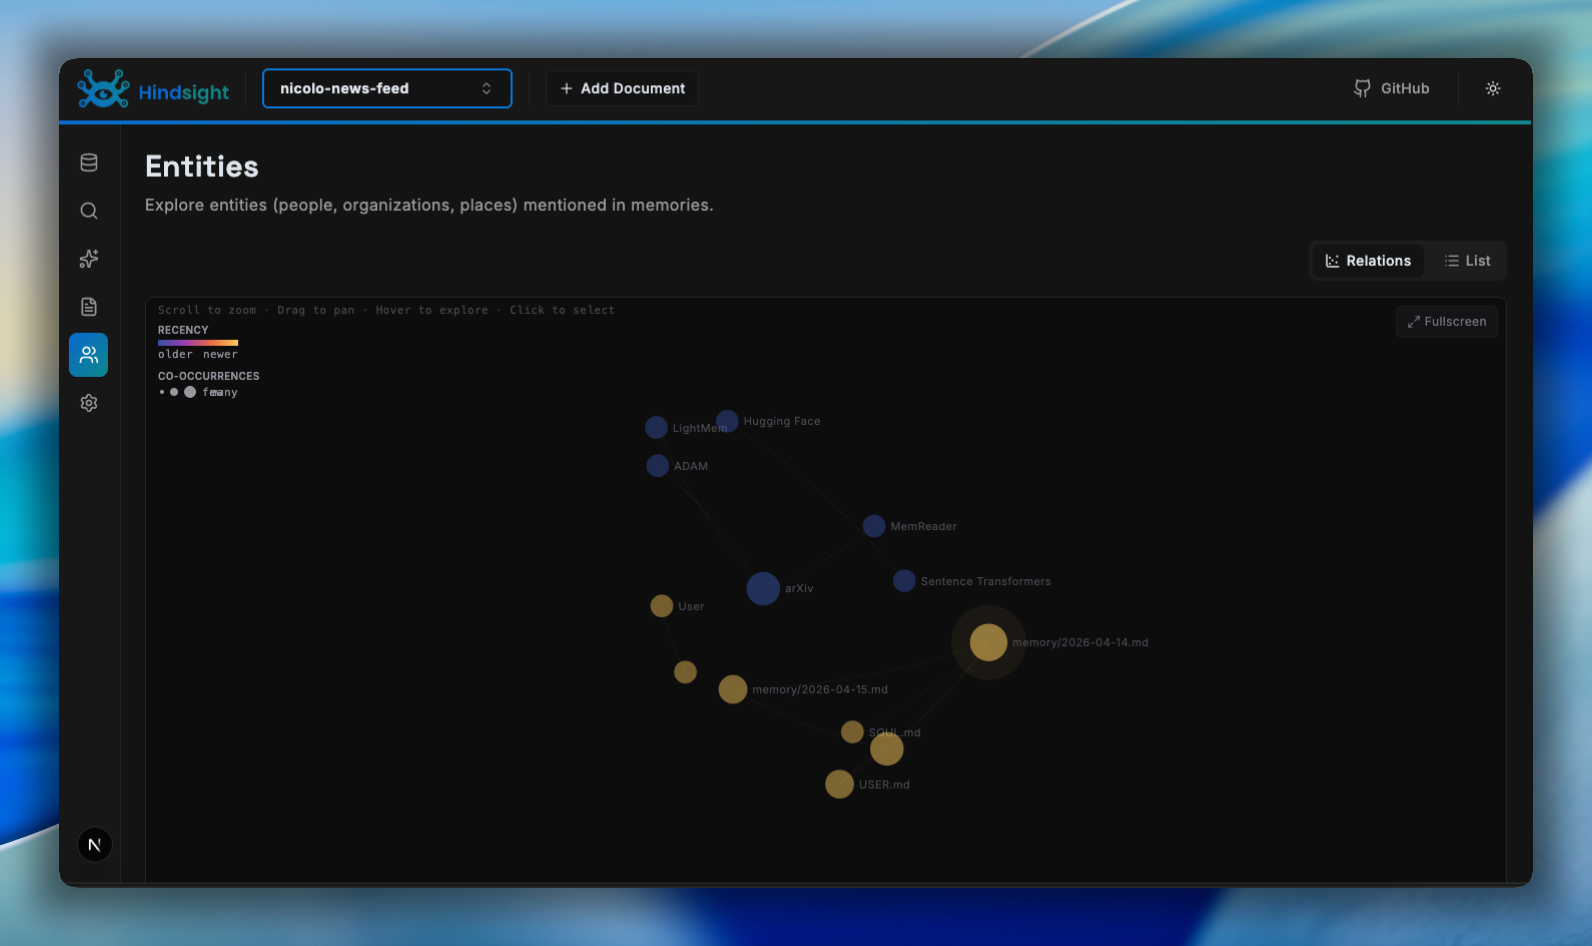
The Entity Co-occurrence Graph, added in Hindsight 0.5.2, complements Constellation View with a different lens: which entities appear together across the memories in a bank.
Where Constellation View shows the typed relationship graph (semantic, temporal, causal, entity links), the Co-occurrence Graph shows empirical co-occurrence — which entities tend to cluster in the same facts. It makes it easy to spot people, projects, and tools that are tightly coupled in practice, and to navigate from any node into the memories that connect them.
The two views work well together:
- Use Constellation View to debug the quality and type distribution of the links being formed
- Use the Co-occurrence Graph to understand which concepts the bank actually associates in practice
Using Constellation View
1. Start wide and look for shape
The first useful move is to zoom out.
At bank scale, you are not reading individual memories yet. You are looking for topology. You want to know:
- Is there one dominant hub in the middle?
- Are there several healthy clusters that correspond to users, projects, or topics?
- Are there isolated islands that probably should connect to something else?
- Is the graph balanced, or is one kind of entity swallowing everything?
This is the equivalent of checking a system dashboard before diving into logs. You are looking for the pattern first.
2. Use link colors to understand why nodes connect
Constellation View color-codes links by type:
- Semantic links in blue
- Temporal links in teal
- Entity links in amber
- Causal links in purple
That matters because not all memory structure means the same thing.
A dense semantic region suggests the bank is discovering conceptual similarity. Strong temporal chains suggest chronological structure. Entity-heavy clustering may tell you the bank is linking around shared people, projects, or objects. Causal links are often the most interesting because they point toward why one fact may matter to another.
If you are debugging recall quality, this helps you quickly ask the right question:
- If two things should be related but only share weak semantic proximity, maybe your extraction is too vague
- If a timeline-heavy workflow is not showing enough temporal structure, maybe your events are not carrying strong enough time signals
- If everything routes through one generic entity, you may need tighter retain guidance to avoid over-linking
3. Hover before you rewrite anything
Hovering a node in Constellation View surfaces metadata that gives the graph context: text, linked entities, context, dates, timestamps, tags, evidence counts, and document references.
A node may look like an important hub, but once you inspect it, you may discover it is only a generic repeated entity with shallow meaning. Or a small-looking node may actually contain the critical piece of context that ties a user's preferences to a project decision.
The graph gives you the map; hover details give you the ground truth.
4. Use stable layout as a before-and-after tool
One of the most practical uses for Constellation View is comparing memory behavior after a configuration change.
Suppose you tighten a retain_mission to stop capturing generic fluff and focus on durable behavioral rules. Or you fix a bug that was preventing useful entities from being extracted. With a stable graph, you can revisit the same bank and ask:
- Did noisy hubs get weaker?
- Did the right clusters become denser?
- Did disconnected regions start to connect?
This does not replace metrics or targeted tests, but it gives you a fast visual sanity check that is surprisingly hard to get any other way.
5. Use it to explain memory to humans
If you are showing Hindsight to an engineer, product teammate, or prospective user, memory can feel abstract. A graph makes the product legible. You can show which concepts became central, how separate conversations joined into one cluster, and why one answer was easier to retrieve than another.
Trust in memory systems is often built through explainability, not just accuracy.
Pitfalls & Edge Cases
A dense graph does not automatically mean good memory. More nodes and more links can look impressive while still producing poor recall. If the bank over-extracts generic entities, the graph may get visually richer while retrieval gets less precise. Use the graph to generate hypotheses, not to declare victory.
Missing structure may be a data problem, not a UI problem. If a cluster is not forming, the source material may not contain enough signal, the retain mission may be too vague, or entities may be normalized poorly. Constellation View is useful precisely because it shows you the absence of structure — but that absence is telling you something about your memory pipeline.
High-fanout entities can dominate your interpretation. Large banks often produce a few entities that connect to everything. If one entity acts like a universal hub, step carefully before drawing conclusions. You may be looking at a real organizing concept, or you may be looking at the memory equivalent of a stop word.
The graph is for humans, not the retrieval engine. Constellation View helps you understand the bank. It does not change what the agent retrieves. It does not improve recall by itself. It does not replace well-scoped banks, strong extraction rules, or careful evaluation.
Tradeoffs & Alternatives
If you are debugging one exact recall failure, a graph may not be your best first tool. Sometimes a plain fact list, recall trace, or entity detail page is faster.
Where Constellation View and the Co-occurrence Graph shine is structural debugging: understanding cluster formation, spotting noisy hubs, seeing how relationship types accumulate, comparing the bank before and after configuration changes, and making memory behavior easier to explain to others.
The tradeoff is simple:
- Use raw facts and recall traces for precise auditing
- Use Constellation View for bank shape, topology, and relationship type distribution
- Use the Co-occurrence Graph for empirical entity clustering and navigation
You probably want all three.
Recap
Constellation View and the Entity Co-occurrence Graph make agent memory visible.
Instead of treating the bank as an opaque component that occasionally returns something surprising, you can inspect the graph itself. You can see hubs, clusters, weak spots, and relationship types. You can debug structural problems faster. You can explain memory behavior more clearly. And you can tell whether your retention strategy is building something useful or just accumulating noise.
The key idea is simple: memory quality is easier to improve when you can see the structure you are creating.
Next Steps
- See what else shipped in Hindsight 0.5.0 and 0.5.2
- Browse the developer quickstart to get a Hindsight server running
- Explore bank templates to standardize your retain configuration across deployments
- Read the cookbook for memory patterns across agent frameworks
- Sign up for Hindsight Cloud to use the Control Plane without running local infrastructure